Auto-Clustering and Serverless Cost
Purpose
The MaxMyCloud Serverless Cost module provides visibility into Snowflake features that incur serverless compute charges—including Auto-Clustering, Materialized Views, Snowpipe, and Search Optimization. Each feature has its own dedicated page, accessible under the unified “Serverless” menu.
This section focuses on a real-world example of Auto-Clustering analysis. The interface and insights discussed apply similarly across the other serverless features.
Understanding the Charts
From the top navigation, go to Serverless → Auto-Clustering. This page presents interactive charts and a detailed summary table designed to help you monitor and optimize Auto-Clustering behavior and cost.
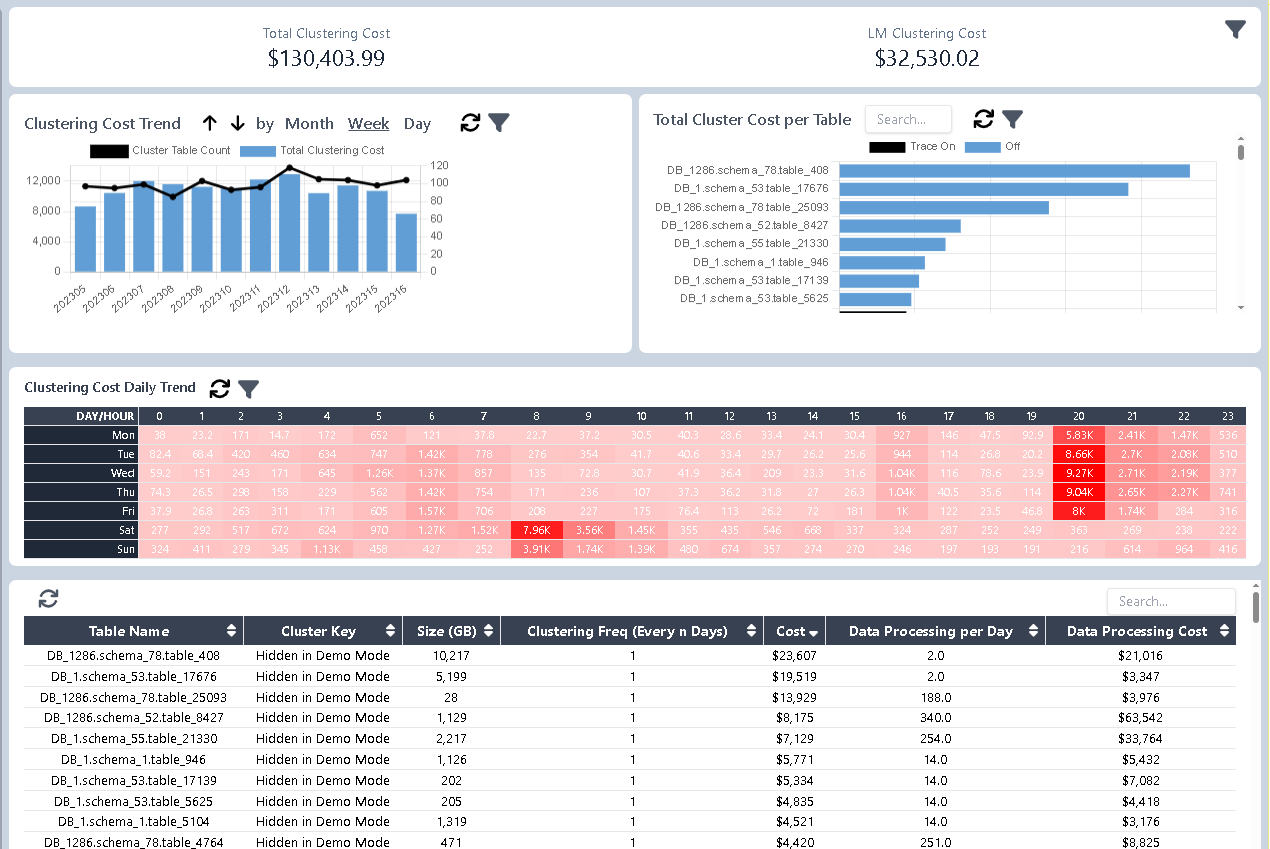
- Summary banner shows the total Auto-Clustering cost for the selected period as well as the last full month.
- Trending line chart follows, illustrating cost patterns over time.
- Top-tables panel highlights tables with the highest Auto-Clustering spend.
- Matrix heatmap visualizes Auto-Clustering activity by day of the week and hour of the day. Darker cells indicate higher costs. Since Auto-Clustering often occurs after data processing jobs, which typically run overnight, it is common to see activity clustered around late-night hours.
Most importantly, a Cost comparison table at the bottom displays Auto-Clustering costs side-by-side with data processing costs for the same tables. This allows you to identify outliers and inefficiencies.
For example, in one case, table408 triggered Auto-Clustering daily and incurred \$23K in clustering costs—surpassing its own \$21K in data processing cost. This signals a potential inefficiency and warrants further investigation.
Optimizing Auto-Clustering Cost
This is not an exhaustive list, but here are key areas to focus on:
- Review and refine clustering keys based on actual query access patterns.
- Tune data processing workflows to reduce the frequency of Auto-Clustering triggers.
Note: You may utilize MaxMyCloud's Clustering Trace feature to evaluate clustering behavior over time.
Clustering Trace: Step-by-Step
To use the Auto-Clustering Trace:
- From the “Top-tables ” chart, highlight the table you're interested in.
- Open the context menu and select “Toggle Trace On”.
- A permission dialog will appear—copy and execute the displayed Snowflake GRANT statement in your account to enable the trace.
- Once enabled, the trace runs hourly.
To view trace results, open the context menu again and select “Trace Details.” A new window will display hourly clustering statistics, including:
- Start Time: Timestamp when the trace began.
- Table ID: Unique Snowflake identifier for the table.
- Cluster Keys: The clustering keys defined for the table.
- Total Constant Partitions: Number of micro-partitions with a constant clustering key value—indicating perfect clustering.
- Total Partitions: Total number of micro-partitions.
- Avg Depth: Average number of partitions scanned to resolve clustering key queries. Lower values indicate more efficient pruning.
- Cluster Ratio: A computed efficiency metric.
1.0 = all partitions are constant (ideal clustering)
0.0 = no partitions are constant (poor clustering)
Use these insights to drive targeted improvements in Auto-Clustering behavior and reduce unnecessary serverless cost.