Data Processing Cost
Purpose
For many organizations, data processing is the most expensive operation in a Snowflake data warehouse. Optimizing data processing costs—especially for the top-consuming tables—can lead to significant savings.
Optimization efforts should also consider the data processing schedule. If a table is updated very frequently (real-time, hourly, multiple times per day), the associated cost rises. Ensure the table is being read or utilized at a similar frequency to justify the expense.
Understanding the Chart
From the top navigation, go to Data Processing → Cost. This page displays two primary charts:
- Top Tables: Lists tables with the highest data processing costs.
- Cost Trend per Query Type: Breaks down cost by query type over time.
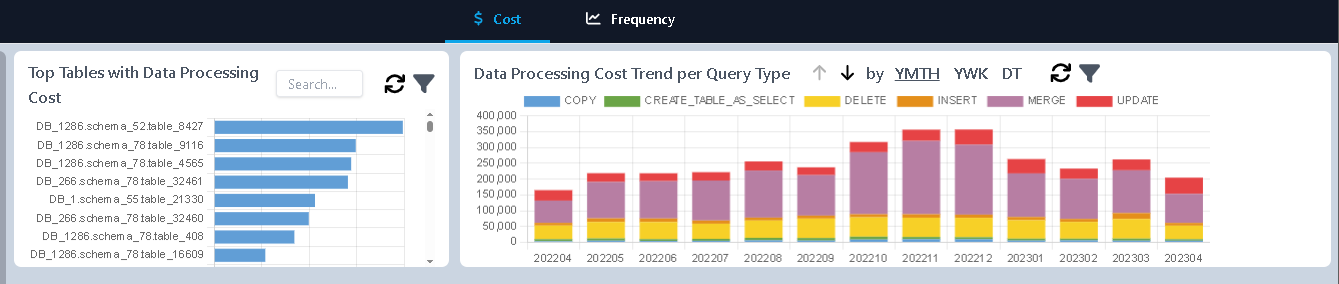
These charts are interactive. For example, if you observe that MERGE queries dominate processing costs in the second chart, click the MERGE legend item. The top tables chart will update to show the most expensive MERGE operations.
You can then highlight a specific table—e.g., table_8427—to display a new chart that breaks down processing operations for that table. In the example shown, there are three operations, with the first alone consuming $14K, far exceeding the others. This signals a strong opportunity for targeted optimization, beginning with the most expensive operations and tables.
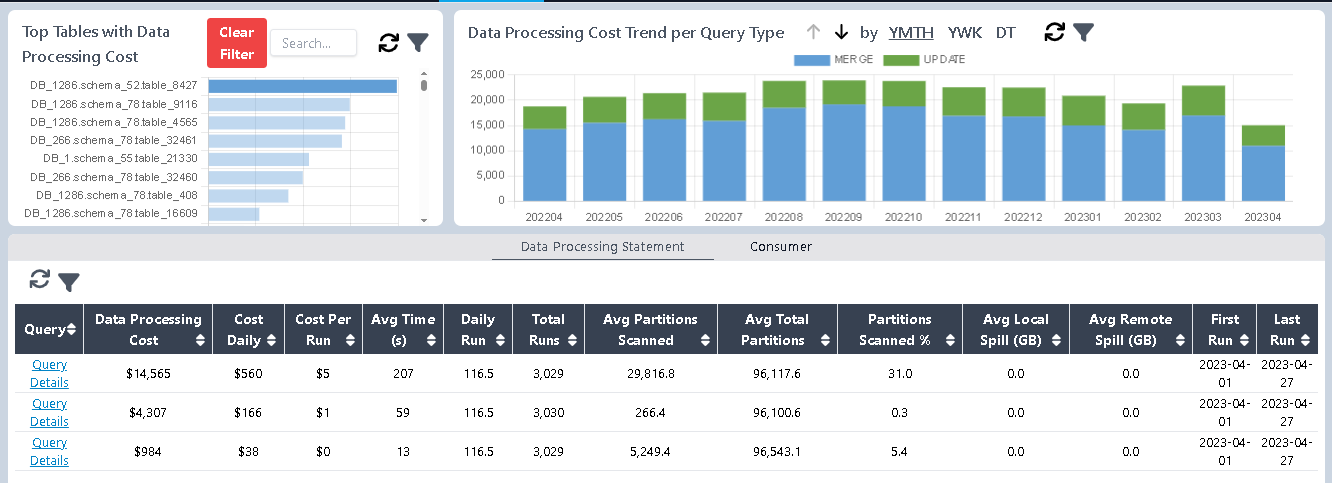
You can review the exact query by clicking on Query Details as well as reviewing key metrics for performance tuning, including:
- Cost Daily
- Daily Runs: How many times the query updates per day
- Cost Per Run
- Average Update Time
- Partitions Scanned%: Percentage of the table scanned—lower is usually better for both performance and cost
Evaluating Table Usage
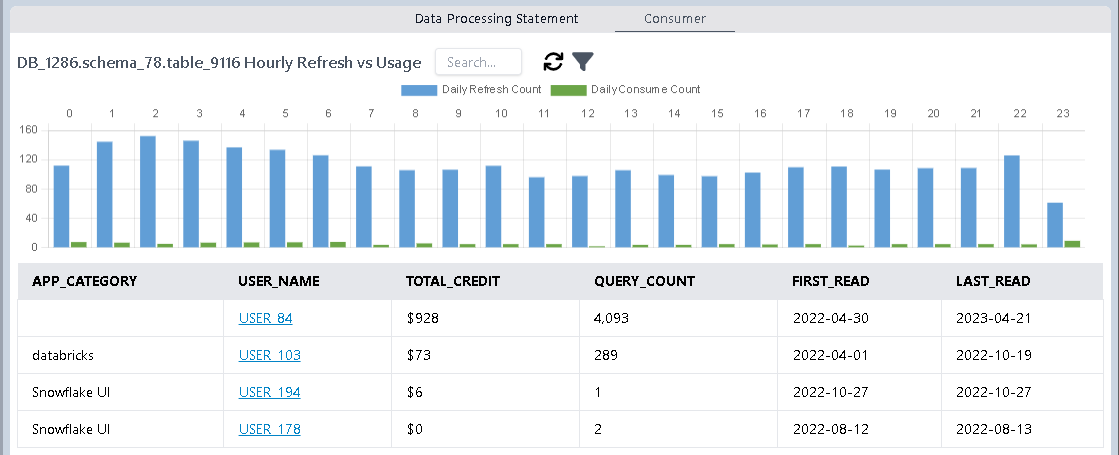
While optimizing data processing is essential, it’s equally important to assess how often those top-cost tables are actually consumed. If a table is updated frequently but rarely queried, there may be a clear opportunity to reduce its update frequency and lower associated costs.
Navigate to the Consumer tab to investigate usage patterns. A bar chart shows a side-by-side comparison of how often a table is updated versus how often it is read, broken down by hour. Below the chart, you can click on a specific user_name to view which users or applications are consuming the table. If read activity is significantly lower than update activity, consider whether the update schedule can be reduced to better align with actual usage.
Data Processing vs. Consumption Frequency
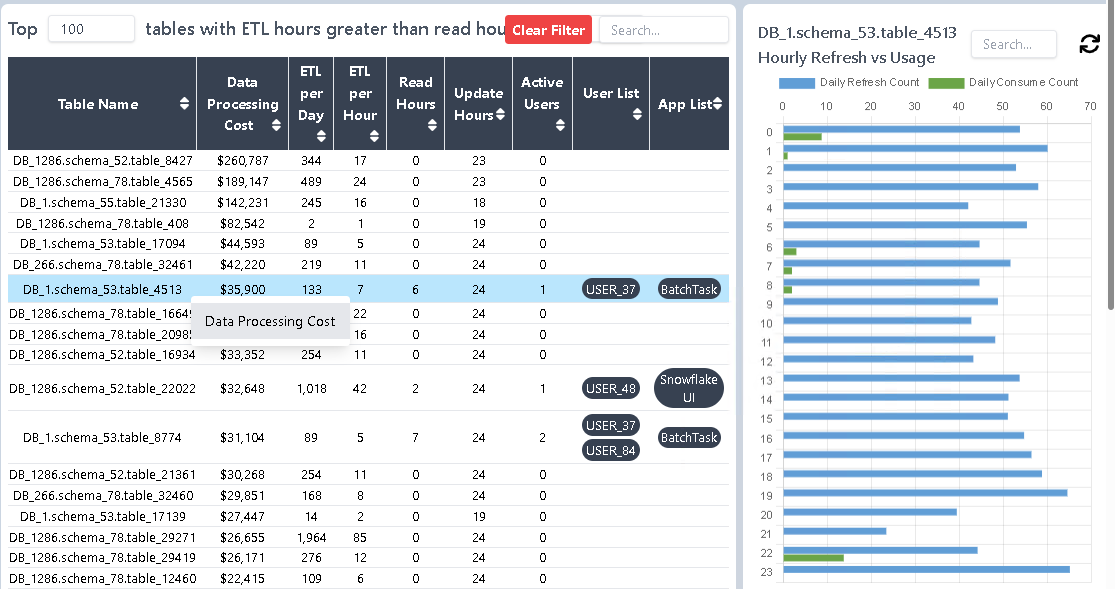
For a broader overview, go to Data Processing → Frequency. This page lists tables where update frequency exceeds consumption frequency.
In one highlighted case, table_4513 incurred over $36,000 in data processing costs, averaging 7 updates per hour across a full 24-hour cycle. However, user consumption was limited to just 6 hours per day. This naturally raises the question: Can we reduce the update frequency to reflect actual usage and save costs?
You can continue exploring from here using the context menu under Data Processing to return to the Cost page and investigate specific operations, query types, and consumption behaviors in more detail.