Capacity Monitoring
Purpose:
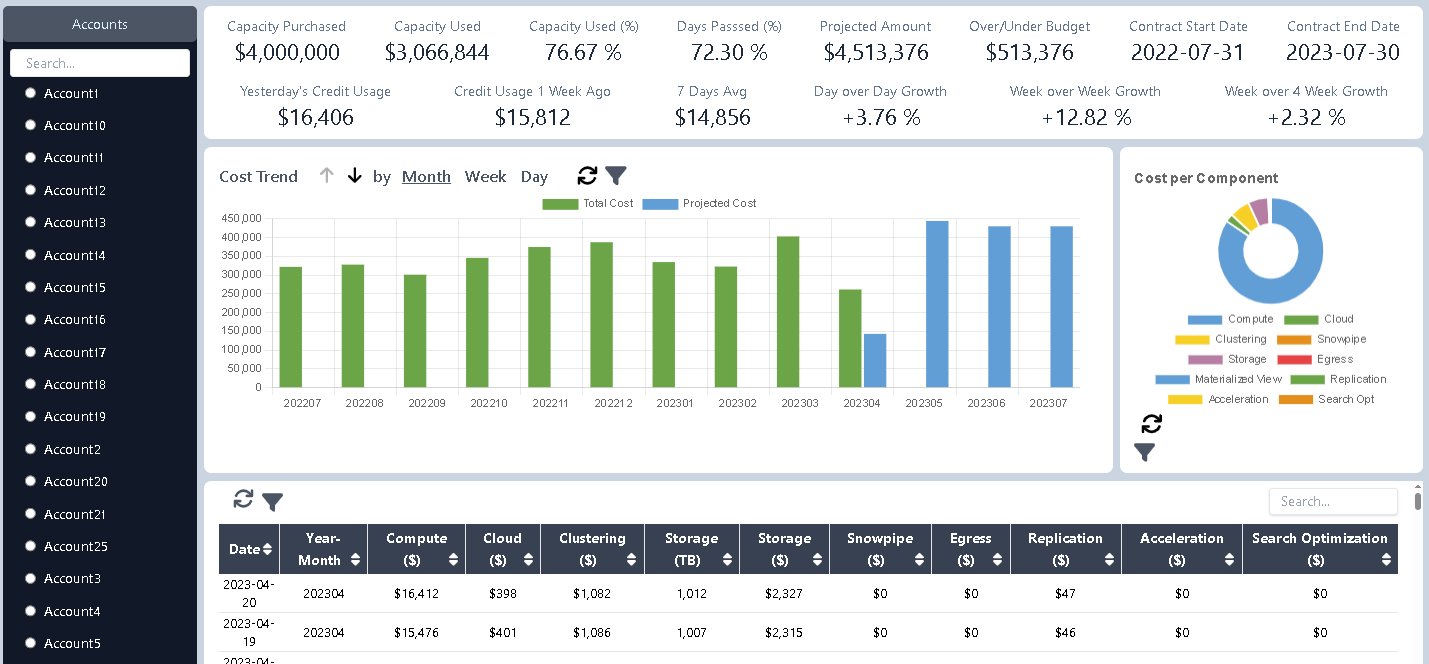
Monitor capacity usage against your contracted amount and understand projected consumption based on current usage trends.
Accessing the Dashboard
From the top menu bar, navigate to the first item labeled "Overall". This will open the Capacity Monitoring dashboard, as shown in the example screenshot.
Understanding the Metrics
In the example shown:
- A total capacity of $4 million was purchased.
- To date, $3 million has been consumed—76% of the purchased capacity.
- Only 72% of the contract period has elapsed, meaning usage is ahead of schedule.
- If the trend continues, projected usage will reach $4.5 million, exceeding the original contract by $500,000.
Action Required: This projected overage should be addressed promptly to avoid budget overruns.
If you are connected to a secondary Snowflake account (not the primary account where organization-level data resides), capacity data may not appear. This is expected behavior. Learn how to switch Snowflake accounts here.
Recent Usage Trends
The second line of the dashboard highlights recent usage patterns. It compares:
- Yesterday's usage
- The same day one week ago
- The 7-day average
In the example, all metrics are trending upward—another clear indicator that usage needs to be addressed quickly.
Cost Trend Dashboard
This chart visualizes how costs evolve over the contract period:
- Green bars: Actual consumption
- Blue bars: Projected consumption
You can toggle between monthly, weekly, and daily views for detailed analysis.
Managing Multiple Accounts
If you manage multiple Snowflake accounts, use the left-hand sidebar to select the desired account. The dashboard will automatically update all visuals and metrics based on your selection.